Data Portrait
Frequent mirror checking is an important signal of appearance anxiety. I have read a report that the teenager would check the mirror about 30 times a day, while old people only have an average of 6 times daily mirror-checking behaviors. I think 30 is such a big number, so I want to test whether I follow this pattern. Then I tracked my mirror gazing behavior for 7 days, clicking different colors of squares to filter with the type of mirrors and clicking circles with different diameters to filter with the duration of mirror-checking.
Reflection
What I have learned about myself through the process of self-tracking
On the sixth day, my mirror checking times are much more than those of the rest days. Because on the third day, I wore makeup and did not wear a mask, while on the other five days, I did. So I learned that wearing a mask can reduce my attention to my appearance. since human attention is a limited resource. So if I have challenging works to do on one day, maybe I could try to wear a mask on that day to spare my attention.
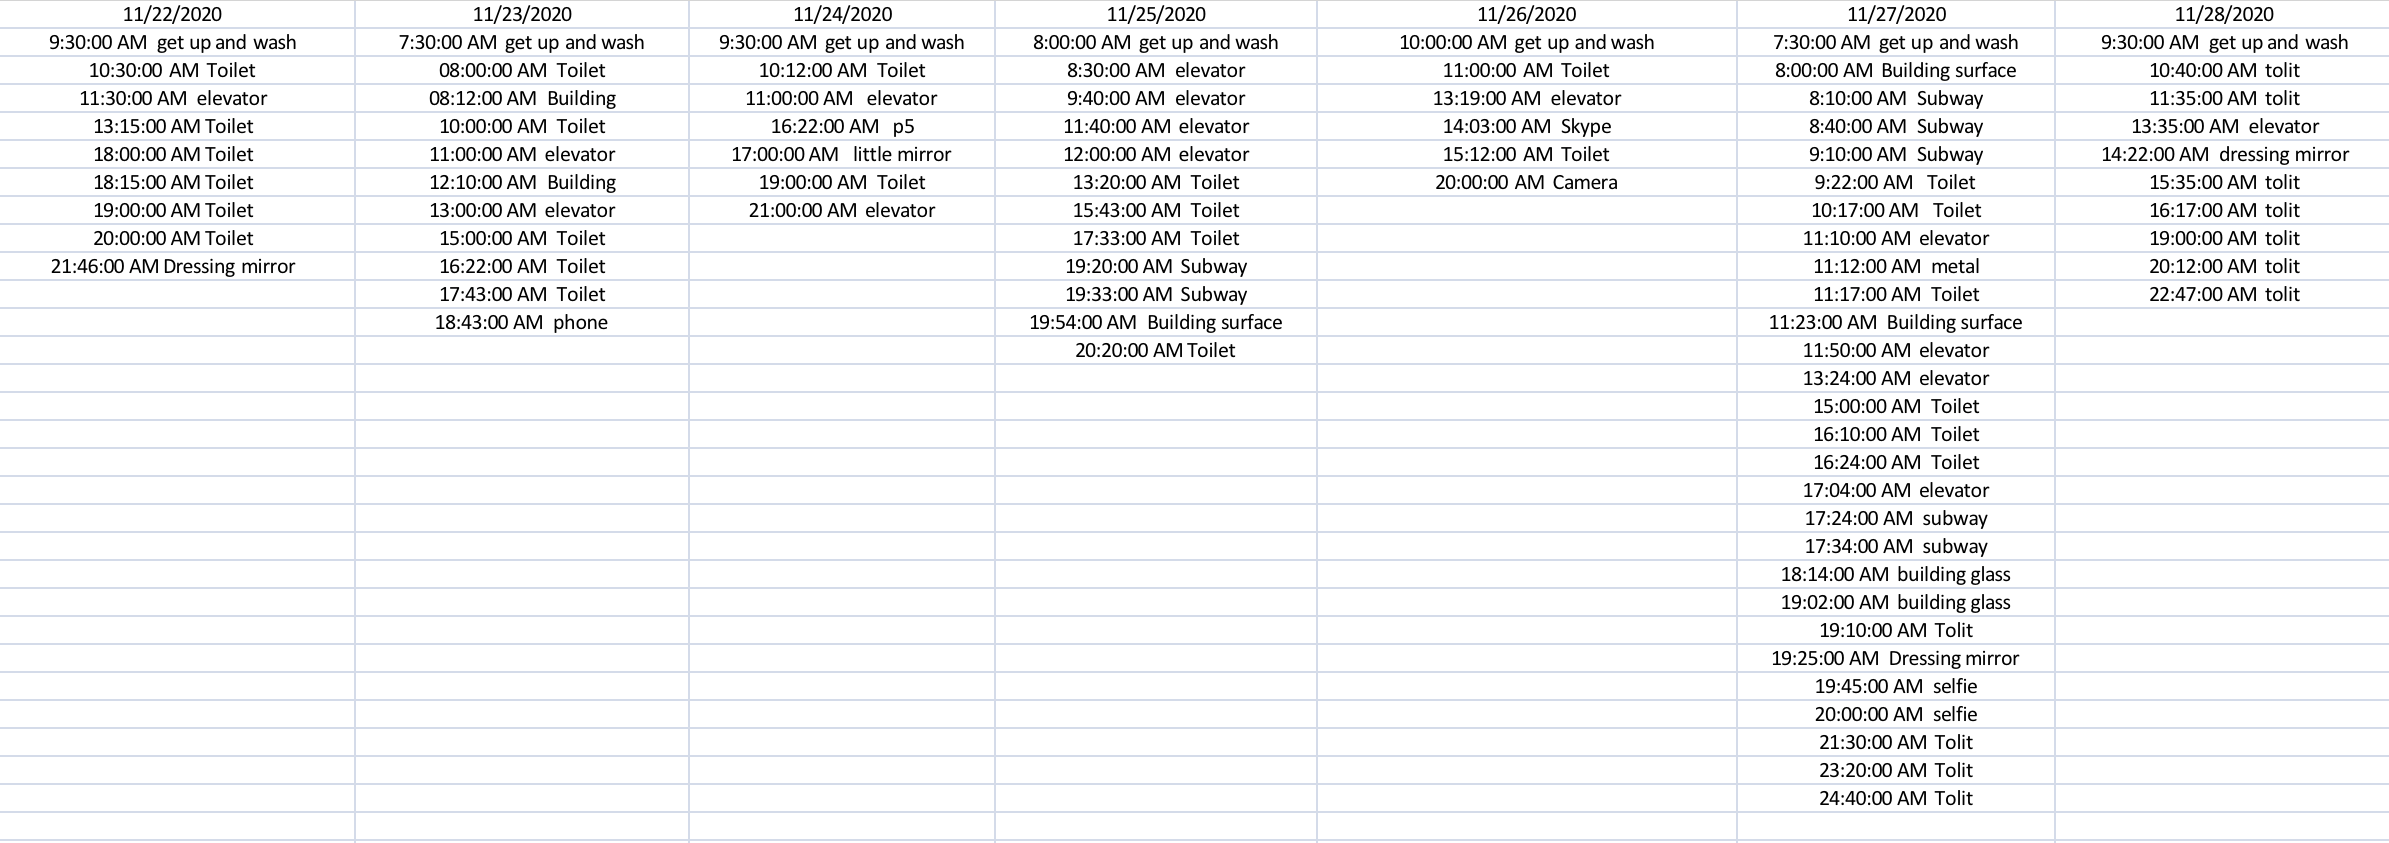
What was gained/lost through the process of data visualization
I use colors to differentiate the types of mirrors. I do not want to make the color too complicated, so I merged all the mirrors I have used into four types. Some information is omitted here, for example, I just classified the building's outside surface, the metal surface in a subway station, the spoons, and the car windows all as the reflector. But I have recorded the detailed information in the initial spreadsheet.